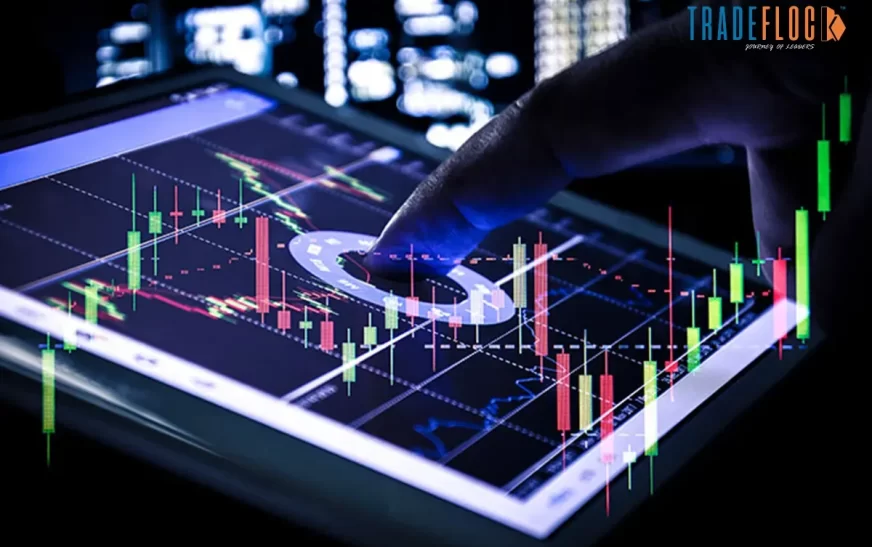
A fluctuating financial market is a blessing in disguise. Why do we say that? As most people fear, even in finance, there is a dynamic market and inconsistent pricing. But once they understand the real game, then it’s just a piece of cake for them. They can turn their dark, bleak nights into blooming mornings. But nobody can do this alone. Of course, we all need help. Here’s what trading indicators do: they simply help you analyse the market trends and price behaviour. Due to their high competency and strong performance, people are searching for the best trading indicators to forecast what could happen in future.
If you also want to learn about the best stock indicators, this is the right place. So, let’s not waste time and dive into our blog.
Understanding Trading Indicators
Trading Indicators are tools which are used to technically analyse the financial market’s overall behaviour. These tools are best for identifying new trends, price movement, and market conditions. Indicators are widely used for analysing a variety of trading instruments, including stocks, forex, indices, and commodities. Although they don’t exactly help to generate the profit, they can help you mitigate the risk before it occurs.
The best trading indicators are mathematical formulas which transform raw price data into visual signals to effectively identify trends, momentum, and volatility. The tools are of two types: leading and lagging. Leading predicts what might happen in future, whereas lagging provides an overview of the past movements. Overall, these indicators are highly useful, but they cannot give you an exact answer, only an assumption.
5 Best Trading Indicators You Need for Effective Trading
There are several trading indicators available, but we’ve picked the best ones for you that offer strong performance and effective results.
1. Simple Moving Average (SMA)
A simple moving average is one of the best trading indicators, which helps in identifying the direction of a price trend over a specific period. What it actually does is it simply takes the average of rising price points over time to create a trend line. This trend line represents increments and decrements in asset value. A simple moving average is a lagging indicator tool that predicts data based on past price trends.
2. Exponential Moving Average (EMA)
Exponential Moving Average generates a trend based on numerous daily price points. However, more weight is provided to the given data points. Though it offers the same information as a simple moving average, using various numbers of price points over a set number of days to create an average price helps in determining whether the trend is helpful or not. The major difference between EMA and SMA, which makes exponential MA the best forex indicator, is that EMA places more emphasis on current prices.
3. Moving Average Convergence Divergence (MACD)
Among others, Moving Average Convergence Divergence (MACD) is one of the best trading indicators for accurately detecting momentum. This indicator compares two moving averages to determine whether prices are moving closer together or further apart. What is observed is that when two price averages move closer together, it indicates decreasing momentum. Or if they are moving apart, that means the momentum might be increasing. MACD is the most reliable and easiest-to-use indicator, making it the best trading indicator for forex.
4. Fibonacci Retracements
Fibonacci Retracements specialise in determining how much the market will go beyond a trend, which means how much it will pull back from the recent trend. Among the list of the best trading indicators, Fibonacci helps traders to analyse the temporary market downturn. Traders identify support or resistance for a new trend based on how strongly the market might be changing direction. Fibonacci Retracements are one of the best stock indicators used for such calculations, which drives accurate results.
5. Bollinger Bands
Bollinger Bands are used to determine the volatility of asset prices within a specific range of time. It computes the moving average of an asset over a period and applies standard deviations above and below the recent price. These standard deviations are called bands that create a time horizon. Bollinger bands are one of the best trading indicators that help understand the market situation. When the price moves above the band’s upper limit for an extended period, the market could be overbought. Similarly, when the prices move below the lower limit, the market could be oversold.
You May Also Like to Read: List of Top Performing Stocks in Asia: Surprising Gains!
Evaluate the Price Trends
The financial market is uncertain. How it moves in certain situations can never be said accurately. However, it can be predicted with the help of trading indicators. In trading, analysing the financial market and how prices are moving can help forecast. But they do not provide exact answers; that’s why they are called indicators. They use various formulas to find how things can move in the future.
Therefore, there are several indicators available, but it is important to pick the one which provides high performance and the most definite results. This is why we have listed the best trading indicators for market updates, research, and useful insights. Trading carries a huge amount of risk, but using the indicator can mitigate the loss effectively.